Let Your $$ Grow
Live below your mean and constantly build up investment portfolio is the key for financial freedom.
Saturday, 27 October 2012
USD/CNH (USD vs Chinese Yuan)
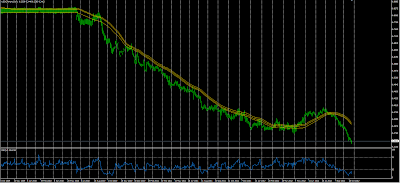
This is D1 chart of USD vs Chinese Yuan currency pair from 2010 till 2012 (present).
Click on the picture to enlarge.
The strategy is simple enough! Do SELL every time you see it goes up! This trend is going to be there for the next few years, or until my further notice.
But in case I forgot to post here, look me up. Thanks. ^_^
Saturday, 16 June 2012
Announcement
Hi all my respectful followers, thanks for your interest following my blog all this time.
But I am sadly to announce that, moving forward, I will only share my knowledge for those who subscribed to my service. If you would like to learn more, please send your inquiries through email to devthefut@hotmail.my (develop_the_future)
Best Regards,
Vincent Thong
But I am sadly to announce that, moving forward, I will only share my knowledge for those who subscribed to my service. If you would like to learn more, please send your inquiries through email to devthefut@hotmail.my (develop_the_future)
Best Regards,
Vincent Thong
Saturday, 12 May 2012
Saturday, 5 May 2012
AUSUSD week9
On 2/5/2012 Australia bank has announce to cut interest rate to 3.75%, because inflation is low, the economic growth is slow. This is a fundamental change, there is no hope for a rise at this AUD USD pair. I haven't close the position, and results in bigger loses. Anyway I will not hesitate to cut out loses on next market day (Monday), no matter what.
Friday, 27 April 2012
AUD/USD week8, 1st Profit Taken
This week the AUD/USD raised. I have took the profit for the $0.10 lot size position. Making a profit of $9.30 dollar.
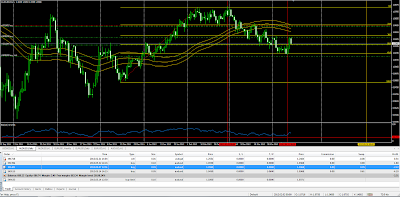
Below is the chart and the open position I remained. Let's see if next week it hit some major resistance, I will take profit again. Well, I earn the exchange rate and also the interest at the same time.
By the way, the results I posted here is just my mini account. I do have a standard account with CMC Markets, investing with similar strategy. That account makes very handsome money, at least to me. Because maybe got millionaire reading my blog, under 100k consider small amount maybe :p
so I don't post that account here.
Friday, 20 April 2012
Trading Update week7 on AUDUSD
AUDUSD closed at 1.0372 this week as shown in the daily chart below.
This week AUDUSD is going sideways, is a sign of trend reversal. Since there is a trade deficit risk in Australia, I don't expect the price can surge very high. I expect to close all the position at some price around 1.0500. In that case, 0.10 and 0.50 lot size positions would have made profits, just the 0.01 lot size position lost. Well, that is my strategy, first entry is a psycho test, so the lot size is small.
Let's see what happen next week.
Saturday, 14 April 2012
Trading Updates week6 on AUDUSD
My Trading Journal, AUD/USD pair:
Oh ya, forgot to mention about the red dotted line. The red dotted line is the TP (take profit). If the market hit that level, my 0.05 lot size opened position will be cashed out.
Today I take a look back on my first open position on this pair (AUDUSD), I just realized that it was opened since 6th March. I have been holding on this trade for 5-6weeks already. Well, nothing special though, I just thought time is flying.
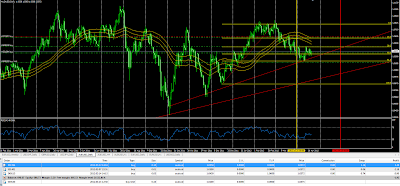
Let's see how this pair performed in the last week. Here is the chart. A daily chart.
So, let me explain the horizontal lines and vertical lines I drawn on the chart.
The horizontal lines are the Fibonacci lines which acts as supports, and if you take a closer look at the green dotted lines, these are the entry long position I had made. And take a look at the bottom of the chart, where it shows my trading records. Look at the AUDUSD pair, then you will notice the first entry position I put is just 0.01 lot size, the next is 0.05 and subsequently is 0.10. This is my strategy to accumulate my position in a falling market.
Next, look at the vertical lines. The first red line is the time where market starts to fall, the second red line is the bottom of the fall (just based on my belief), and the yellow line drawn at May 28th should be the top of the rise. So all my open buying position should be cashed out sometime around before May 28th.
Well, what had happened to the markets in the last week? Hmm... nothing strange, everything looked just as expected. So, nothing to comment here. See you next week!
Oh ya, forgot to mention about the red dotted line. The red dotted line is the TP (take profit). If the market hit that level, my 0.05 lot size opened position will be cashed out.
Ok, let's see how this AUDUSD pair performs in the next week. See you again!
Subscribe to:
Comments (Atom)


