Today I take a look back on my first open position on this pair (AUDUSD), I just realized that it was opened since 6th March. I have been holding on this trade for 5-6weeks already. Well, nothing special though, I just thought time is flying.
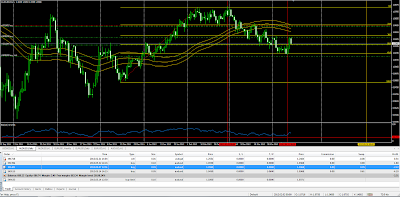
Let's see how this pair performed in the last week. Here is the chart. A daily chart.
So, let me explain the horizontal lines and vertical lines I drawn on the chart.
The horizontal lines are the Fibonacci lines which acts as supports, and if you take a closer look at the green dotted lines, these are the entry long position I had made. And take a look at the bottom of the chart, where it shows my trading records. Look at the AUDUSD pair, then you will notice the first entry position I put is just 0.01 lot size, the next is 0.05 and subsequently is 0.10. This is my strategy to accumulate my position in a falling market.
Next, look at the vertical lines. The first red line is the time where market starts to fall, the second red line is the bottom of the fall (just based on my belief), and the yellow line drawn at May 28th should be the top of the rise. So all my open buying position should be cashed out sometime around before May 28th.
Well, what had happened to the markets in the last week? Hmm... nothing strange, everything looked just as expected. So, nothing to comment here. See you next week!
Oh ya, forgot to mention about the red dotted line. The red dotted line is the TP (take profit). If the market hit that level, my 0.05 lot size opened position will be cashed out.
Ok, let's see how this AUDUSD pair performs in the next week. See you again!

No comments:
Post a Comment